Citunius Business Visualizer
Your chatbot for productivity
Business Bot (Chatbot): Citunius® Business Visualizer
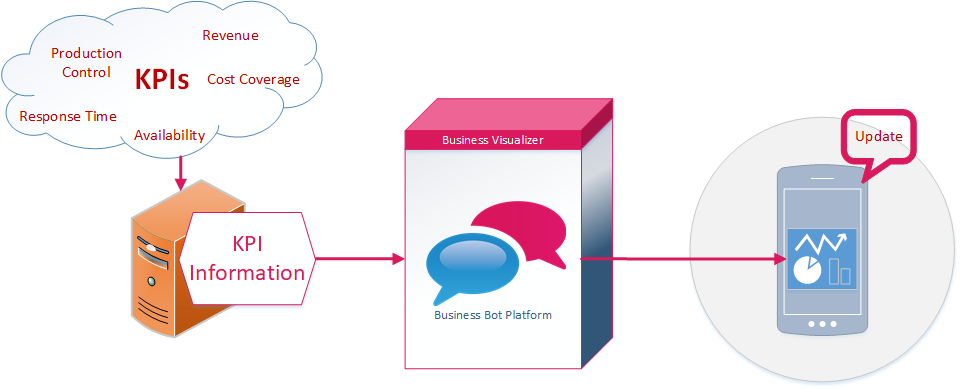
The chatbot allows you to have an optimal all-round view of various business data. You can get important business information via instant message and have it visualized. For managers, this tool represents an information advantage because defined indicators (KPIs) can be retrieved real-time at the right time in the meeting. It is no longer necessary to log in to the Key Performance Indicator (KPI) monitoring system. This not only saves valuable time for other activities, but also gives you the opportunity to proactively take action.
Would you like to know more about this solution?
What are the advantages of the Business Visualizer?
Benefits at a glance
Reduce Costs
Recognize fluctuations in key performance indicators (KPIs) at an early stage to proactively initiate appropriate actions.
Satisfied Customers
Through real-time information, actions can be initiated immediately when customer complaints suddenly increase because services are not available (e.g., webshop unavailable).
Overview of KPIs
Do not lose the overview in column of figures. Visual presented information can be interpreted faster. This will give you valuable time back to take actions.
What are the technical advantages of the Business Visualizer?
Benefits at a glance
Data Source
The data can be obtained from any source. Either static (as a file) or dynamic as real-time data from the business system. The creation of the chart takes place automatically.
Selection of charts
We offer a variety of charts. For example, your data can be visualized as bar-, pie-, line-, area-, dial-, or GANTT chart.
Adaptable to your requirements
The Business Visualizer can be customized by our experts to meet your requirements.
How does the Business Visualizer work?
The information can be obtained from any data source. It does not matter which business units the data comes from (such as performance metrics for analyzing, controlling, and evaluating processes). The Chatbot Business Visualizer gets the information from the data source and prepares the data visually (creates the graphic). The newly generated chart will be sent from the Business Bot platform to the mobile user.